


Token Fire Sale
A recent article, whose author possesses a remarkable gift for understatement, opened by noting that “Bitcoin has seen better days.” Those better days might include last summer, when tokens were being exchanged for $126,000 each. Today, you can buy an individual bitcoin on one of the exchanges for $64,000-roughly a 50% drop in value in less than a year.
Of course, this has happened before. In 2022, when the crypto exchange FTX collapsed in scandal, digital assets took an even deeper plunge. Bitcoin, the supposed gold standard of crypto, dropped 76% from its all-time high. There was a similar price collapse in 2018, and in 2014 another trading platform, called Mt. Gox, lost its way and took Bitcoin’s price down with it.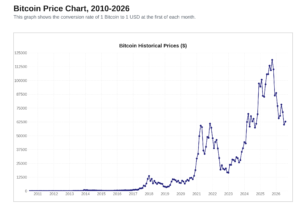
But for a variety of reasons, this plunge feels different. For one thing, there has been no obvious trigger like the collapse of a major exchange. Instead, higher inflation and global uncertainty has led some investors move into securities that have actual, tangible value and don’t create return graphs that look like they’re tracing the movements of a ping pong ball. In other cases, companies were borrowing money to purchase the tokens a fantastically risky strategy for such a volatile asset. One company, perhaps ironically called Strategy (it bills itself as a ‘digital stockpile’) has lost 75% of its value in the digital downturn.
Meanwhile, ETFs that proposed to invest in crypto assets-somewhat legitimizing the asset by taking it out of cold storage wallets and putting it in retirement portfolios-have seen outflows totaling $3 billion. At worst, this could lead to a fire sale of the tokens, which is never a positive sign for any asset.
And finally, interest rates and bond yields are ticking up, drawing investor dollars away from tokens that don’t generate any interest payments. In retrospect, bitcoin thrived in a historically-low interest rate environment, and now has to convince investors that the tokens are worth foregoing the income the money to buy them would otherwise earn.
Which, of course, is what hardcore bitcoin purists (called ‘maxis‘ in the community) are saying: that the digital currency always seems to recover from these $200 billion collapses, and bitcoin is going to the moon. Their narrative is that capital is currently being sucked out of crypto into artificial intelligence (another highly-speculative asset at current prices), but this is a temporary phenomenon that will soon reverse itself. Bitcoin lives or dies based on the story-that is, the belief that whatever you buy, at whatever price, you will always be able to sell to somebody at a much higher price down the road.
We’ll see.
SpaceX Stock Crash
Man, that SpaceX initial public offering was really exciting, right? The stock shares were put on the market at $135 a share, but opened trading at $150 per share and closed the first day at $160.95. The shares continued to rocket (ahem) up to $225.60 per share, before investors began realizing that the company was not in imminent danger of putting humans on Mars, or building that orbiting data center featured so prominently in the prospectus.
Today, just days later, buyers at the peak can sell a share of the company at around $145, which surely is an opportunity to build character and earn sympathy. If they decide to hang on, they will be privileged to participate in deep losses in SpaceX’s AI (Grok) division and launch unit. Analysts are now projecting that the company will post negative free cash flow through 2029, so they’re in on the ground floor of that as well.
On the plus side, SpaceX’s Starlink satellite-internet unit, with more than 10,000 active satellites in low Earth orbit, generates more than $11 billion a year in revenue, which subsidizes the other elements of a speculative business plan. The space launching business is estimated to lose $657 million a year and is spending $3 billion on the Starship that is being constructed to colonize Mars. Grok loses $30 billion a year and is trying to get a foothold in an extremely competitive AI market.
Interestingly, the launch unit may be awash in business in the future, not because of outside demand, but because the Starlink satellites circling the Earth are designed to stay in orbit for just 5-7 years before falling back through the atmosphere in a controlled deorbit. At a minimum, to stay abreast of today’s global internet coverage, the company would have to send up 1,500 new satellites a year-at internally subsidized prices of $120,000 to $300,000 per satellite.
Market analyst and institutional investor Jeremy Grantham recently called the SpaceX offering “the craziest IPO in human history,” and suggested that he’d only be interested in investing at ten cents on the dollar. Some overstimulated early investors, caught up in the hype, are slowly discovering what the professionals already know.
Trump Account Basics
The highly-publicized Trump Accounts (technically 530A accounts) are now available to families with children under the age of 18. If the child was born in the U.S. between the start of 2025 through the end of 2028, their account will be seeded with $1,000 from the government. Otherwise, the accounts can be opened for any children with a valid Social Security number who are under 18 years of age.
Starting on July 4, 2026, a family can contribute up to $5,000 to each account per year. (The government’s $1,000 contribution in the first year for very young children does not count against the limit.) Unlike IRA contributions, the money put into a Trump account does not qualify for a tax deduction; however, in an interesting quirk, employers can, if they wish, contribute $2,500 per employee through a Section 125 Cafeteria plan, which would count toward that $5,000 limit, but would qualify as a pre-tax (deductible) contribution.
The account would grow tax-free until, at age 18, it turns into a traditional IRA and becomes the child’s property. At that point, it can be converted into a Roth account, so long as the 18 year old pays tax in the balance of the account. Many tax planners would recommend this rollover because the 18-year-old’s income tax rate is almost certainly lower than it will be when he or she retires.
People can sign up on the official Trump accounts portal (https://trumpaccounts.gov/, telling us “The American Dream Starts Now”), or they can download the Trump Accounts app on the Apple App Store. But to open the account, you’d need to either submit IRS Form 4547, which is a formal election of eligibility for children to participate, or by verifying their identity, creating login credentials and entering names, dates of birth and Social Security numbers as they would appear on IRS Form 4547.
Parents, legal guardians, grandchildren and adult siblings can make the application. Once the IRS processes the election, the individual who completed the activation process becomes the responsible party to manage the account until the child reaches age 18.
Critics have noted that the Trump Account funds are unavailable to be distributed until age 18, and earnings and matching contributions are taxed as ordinary income upon withdrawal, unlike Roth IRA withdrawals (not taxed at all) or taxable accounts (where withdrawals often qualify for long-term capital gains tax rates). A brokerage account invested in a low-or no-dividend mutual fund could potentially outperform a Trump account. And brokerage accounts don’t come with contribution limits.
Finally, there isn’t a lot of flexibility in how Trump accounts are invested. The U.S. Treasury Department, which is in charge of rolling out the program, has announced that all contributions for all accounts will be invested, initially, in the State Street SPDR Portfolio S&P 500 ETF — a conservative index fund with a low expense ratio of 0.2%. Over time, the government will allow account holders to select from a Blackrock S&P 500 ETF, a State Street S&P 1500 ETF, and/or an iShares Total Stock Market ETF or a Vanguard ETF that also invests in all available public shares.
Bond Yield Consequences
In the nonintuitive world of bond trading, a rise in yields is described as a ‘selloff,’ while yields falling is described as a ‘rally.’ The reasons are not too complicated: when people are avoiding bonds, it means that they’re demanding higher yields to compensate for real or perceived risks. When there is demand for bonds, it means that they’re willing to settle for lower yields.
Armed with that explanation, we can see that a jump in the yield of the U.S. government’s 10-year Treasury bonds to 4.7% — the highest rate since January 2025-constitutes a mini-bear market in bonds. Analysts have given conflicting reasons, but some have pointed to the on-again, off-again war in Iran, while others believe that bond investors think the Federal Reserve’s recent decision not to raise rates to fight inflation was a mistake. (Inflation eats into the real returns of fixed income investments.)
A bond bear’s biggest real-world impacts are on home mortgages and the federal government’s finances. The 30-year fixed mortgage rate generally goes up or down in tandem with the 10-year Treasury yield — remaining at between 1.5 and 1.75 percentage points higher. The recent uptick in rates, of course, makes it more expensive to buy a new home, which could suppress the home buying component of future Gross Domestic Product (GDP) calculations.
And in aggregate, the uptick in bond rates raised U.S. government borrowing costs to their highest level since 2007. Interest payments on the total government debt is projected to exceed $1.04 trillion for the full fiscal year. That figure was $345 billion as recently as 2020. In fact, this will be the first year in modern history that the government will spend more money on debt service than it will spend on national defense. As the Congressional debate over funding the government plows on, it’s fair to wonder how long THAT can go on.
Down, Up and Sideways
The U.S. markets delivered an interesting week, with a vertiginous 1.52% drop in the S&P 500 on Wednesday, and the Nasdaq index down 1.74% on the day. The 10-year Treasury bond yield jumped 7 basis points, which counts as exciting news in the bond market. And, of course, oil prices continued their up and down journey with another price surge.
The next day saw a rally, with the S&P 500 rising 0.21%, Nasdaq going up 0.22% and oil prices declining slightly, as Iran’s leadership decided to come back to the negotiating table. Friday returns saw a 1% gain for the Nasdaq index and a 0.7% one day gain for the S&P 500.
For all the excitement, most stock portfolios were largely even from Monday to Friday and from the beginning of the month to the end. This illustrates an important point for people who rely on equities to eventually fund their retirement. Daily price movements are far jumpier (and queasier on the stomach) than weekly, and monthly price movements are much smoother than weekly. Your blood pressure level can be lowered simply by moving away from checking daily to weekly, weekly to monthly, monthly to (dare one hope?) yearly.
It’s the same dynamic with less liquid assets like a family home. Most people believe that real estate prices rise smoothly along with inflation. But that’s because they aren’t able to get a precise appraisal every day-or even every year, in most cases. Not having access to pricing information smooths out all the wobbles.
Even in positive years, the markets drop an average of 13-14 percent at some point between January and December. Those downturns are a normal part of market psychology, where the herd temporarily goes into panic mode, only to realize that the danger is not nearly as great as they realized. It’s helpful to remember that the worst 10-year return in the S&P 500 in the modern era is very nearly a gain: -0.9% in the ‘lost decade’ from 2000-2009 — years which included examples of real panic: a 22.10% loss in 2002 and a 37% decline in 2008. The markets have a way of smoothing out the journey so long as we allow them to.
Populations Falling and Rising
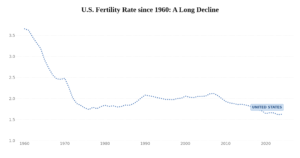
One of the statistics you rarely hear about is the declining birth rate in much of the world. The population of any given country remains stable when the birth rate is at or around 2.1-that is, when each female of childbirth age has roughly two children-on average, of course. Below that figure, absent immigration, the number of citizens goes into decline.
Knowing that, it might be interesting to note that the U.S.’s current fertility rate is 1.6, and has been below replacement since at least 2009.
The U.S. has a lot of company. China (1.0), Singapore (1.0), Chile (1.1), Japan (1.1), Spain (1.1), Poland (1.1), Italy (1.2), Thailand (1.2), Estonia (1.2), Greece (1.2), Canada (1.3), Finland (1.3), Austria (1.3), Russia (1.4), the Netherlands (1.4), Hungary (1.4), Belgium (1.4), Portugal (1.4), Norway (1.4), Germany (1.4), Ireland (1.5), Denmark (1.5), Australia (1.5), Malaysia (1.5), Croatia (1.5), Slovenia (1.5), Turkey (1.5), Brazil (1.6), France (1.6) and Great Britain (1.6) all have fertility rates at or below American levels. One of the jokes among demographers is that Italians are becoming an endangered species after years of low birth rates. But perhaps the same could be said for a number of other countries-including South Korea, which holds the record for the lowest international fertility rate, at 0.7.
The obvious thing to note on this list is that they are all, more or less, above average in terms of per capital wealth and income, with access
to health care, education and work opportunities for men and women. Italy currently has the third-highest per capita income in the world, while Spain and Japan are in the top 10, along with Norway, Denmark, the Netherlands and Spain.
When you look at lower-per-capita countries around the world, you still see falling fertility rates, but which are still well above replacement level: Somalia (6.0), Chad (6.0), Central African Republic (6.0), Niger (5.9), Angola (5.0), Afghanistan (4.8), Mali (5.5), Mauritania (4.6), Yemen (4.5), Tanzania (4.5), Cameroon (4.3), Uganda (4.2), Ivory Coast (4.2), Guinea (4.1) and Zambia (4.0).
India is an interesting example of this. It’s overall fertility rate has dropped to 1.9, but the poorer states of Bihar (2.9) and Uttar Pradesh (2.6) pull the average up, while the more prosperous states like New Delhi (1.2), Tamil (1.3) and Kerala (1.3) are leaking citizenry.
Average it all out, and the world’s population (roughly 8.3 billion as you read this) is rising by about 69 million people each year. That works out to an annual growth rate of 0.84%, down from a peak of over 2% a year in the 1960s. If current trends continue, then the United Nations estimates that global population growth will gradually slow to a stop sometime around 2080, and begin a long, slow decline from a peak of roughly 10.2 billion souls on this increasingly crowded planet.
Download a PDF version of this article below.