


The SpaceX IPO is going to dominate the financial press for the next couple of weeks, and there is already a bit of hand-wringing over it. Some of the concern focuses on how companies going public are supposed to, in exchange for the general public’s money, make themselves accountable to the shareholders who have invested in it. SpaceX founder Elon Musk slammed the door on accountability. Even though he’ll hold just over 40% of the company’s post-IPO equity, he’ll maintain 85% voting control, which means no mere shareholder will be permitted to challenge his decisions.
The prospectus also mandates that investors cannot initiate a class-action lawsuit. If Chairperson Musk decides to put all of the company’s profits into his own pocket, there is no mechanism to challenge the decision. He cannot be fired as CEO unless he agrees.
Other areas of concern focus on the fact that the company is going public at a valuation that is more than 100 times revenues for a company that happens to have been unprofitable since inception. (By comparison, the average multiple of stocks in the S&P 500—most of which tend to generate actual profits—is roughly 20.)
But a more interesting concern is how the stock is elbowing its way into the Nasdaq 100 index at a valuation that is almost certainly inflated. Somehow, Musk or the brokerage team selling SpaceX shares in the IPO market convinced Nasdaq to change its inclusion rules this one time—from a 12 month waiting period after the IPO (to prove its price stability) to a new ‘fast entry’ rule that allows the new publicly-traded stock into the Nasdaq club after just 15 trading days.
Nasdaq also waived a less well-known rule that required at least 10% of a company to be sold to public investors before it can be listed. The SpaceX IPO will sell just five percent of its total shares; in fact, one could argue that, even after it raises $75 billion from the general public, SpaceX won’t be a true public company for the reasons listed above.
SpaceX will soon become the one of the largest components of the tech-related index—an estimated 7.4% of its total value based on the current IPO valuation. That means other stocks will have to ‘move over’ in order to make room for it. In practical terms, an index fund that tracks the Nasdaq 100 would have to sell proportionate shares of the other stocks in order to buy SpaceX shares at the current price.
By one estimate, Apple computer, which makes up roughly 9% of the Nasdaq index at the moment, would have to be trimmed down to 8.3%—meaning index funds will drop billions of Apple shares on the market over the next week or two. This is not because Apple did anything wrong or reported earnings issues; it is simply because the index math demanded a reallocation. All of the other companies in the Nasdaq index will experience the same stock dump, which could depress share prices of other tech firms.
One index that has held its ground on its rules of inclusion is the S&P 500. The widely-covered index requires that companies show a profit before they can join its club. That might not happen with SpaceX until and unless it has constructed data centers in the sky and has employees walking around the surface of Mars.
Debt Up, Savings Down
According to the U.S. Bureau of Economic Analysis, today’s consumers, on average, are saving about 2.6% of their total disposable income. This is low by historical standards, and well below the 4.3% rate recorded in January. Back in 2023 and 2024, the rate was a much healthier 6%.
Economists get nervous when the rate is too high or too low. Too high, and it means that consumers aren’t buying goods and services—and consumer spending makes up around 70% of the economy’s overall growth. The economy could suffer a recession. Too low, and it means that people might have trouble making their debt payments, generating a potential debt crisis that could lead to bankruptcies and… a recession.
How likely is it that debt scenario? It turns out that total debt liabilities among U.S. households has grown to a record $19.9 trillion—a sign that Americans are borrowing to fund their spending. On average, the 133.7 million households each owe roughly $150,000 in debt. (Of course, that varies per individual household.)
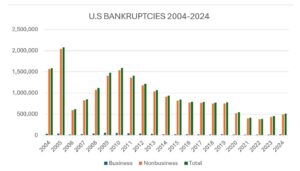
Is there any sign of growing bankruptcy activity? According to Debt.org, the number of people seeking debt relief in the courts grew 26.8% from 2023 to 2025, and bankruptcies through the end of March were up another 11%. You can see on the chart, which only covers data through 2024, that the bankruptcy phenomenon tends to be somewhat cyclical. From 2006 through 2010, bankruptcies rose, then fell through 2022. They’re on the rise again, and if they follow a similar pattern, we could experience a recession in a year or two.
How could the U.S. avert that scenario? An economist would tell you that people should save more, and spend more, and pay down more debt. Good luck trying to put that into practice.
Social Security’s Deepening Crisis
The most recent report from the Social Security Administration tells us that, absent any changes (raising tax rates, cutting benefits, changing the claiming ages etc.), the Social Security trust fund will run out of money in 2032—6 years from now. Of course, that won’t end Social Security; 185 million people will still pay payroll taxes on their wages and earnings, enough to pay roughly 78% of the payments 70 million retirees had expected to receive.
It’s important to understand that this is a projection of an uncertain future. After the Covid pandemic, the trust fund’s depletion date was pushed out a couple of years, due to fewer people alive to claim benefits. A recession or depression could reduce payroll tax revenues; a booming economy could raise them. But these would be marginal shifts of a couple of years either way.
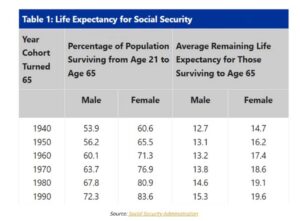
Part of the funding problem has been that people are living longer. In 1940, when Social Security was still a new program, only about 54% of male and 60% of female workers survived to full benefit age of 65. In 1990, those numbers rose to 72.3 and 83.6, respectively, and the age statistics have gone up since then—meaning that the average worker is collecting roughly 5-7 additional years of benefits.
What to do? The report offers two possible fixes. One is to reduce benefits by 25.2 percent across the board. Another is to raise the combined payroll tax rate from the current 12.4 percent to 16.65 percent. If one or the other of those solutions were enacted in January (which is hardly likely), then the Social Security system would be able to make full payment of the scheduled benefits for the next 75 years. If we wait a year, the benefit cut would have to be steeper or the tax rate hike would have to be higher.
And Congress has already waited 43 years to address this issue. The last significant changes to address Social Security solvency were enacted in 1983. To see how these numbers add up while Congress fiddles, consider that the 2010 report told us that a payroll tax increase to 14.4% would have been sufficient to fund full Social Security for the next 75 years.
It’s doubtful that members of Congress, who are accountable to voters, would decide to anger the elderly voters who are the most reliable people in the country to cast a ballot. That means that it’s likely that people who are currently receiving a Social Security check, and people who are near retirement age, will, somehow, some way, get their full benefits. The real question is how much of the burden Congress will dump on younger American workers, and how much of a benefit cut they will receive when it’s their turn to retire.
Second Quarter 2026 Investment Report
This may be the most unexpected rally since the Covid recovery in 2020, with the second quarter showing remarkable gains after all the uncertainty weighted down the markets in the first three months of the year.
A breakdown shows that just about anybody who invested anywhere in the markets experienced unusual gains. The Wilshire 5000 Total Market Index—the broadest measure of U.S. stocks—gained 13.92% in the second quarter, and is now up 9.70% for the year’s first half. The comparable Russell 3000 index is up 10.61% so far this year.
Looking at large cap stocks, the Russell 1000 large-cap index delivered an 10.08% gain in the first half of the year. The widely-quoted S&P 500 index of large company stocks is up 9.32% as of the end of June. The Russell Midcap Index, meanwhile, has gained 27.64% for the year so far.
As measured by the Russell 2000 Small-Cap Index, investors in smaller companies have reaped a 22.18% gain. The technology-heavy Nasdaq Composite Index gained 12.8% in the second quarter, and now stands at a 21.4% return for the first half of the year.
Foreign markets returns were a bit more muted. The broad-based EAFE index of companies in developed foreign economies gained 9.80%, in dollar terms, in the second quarter of 2026, to post a 7.74% gain for the first six months of 2026. European stocks, in aggregate, are now sitting on a 5.92% gain for the year, while the Far Eastern index is up 12.84%. Emerging market stocks of less developed countries, as represented by the EAFE EM index, gained 22.68% for investors in the first six months of the year.
Real estate securities have shrugged off the threat of higher borrowing costs and are now posting real gains. The S&P U.S. REIT index has delivered a 15.75% return for the first half of the year. Meanwhile, the S&P GSCI index, which measures commodities returns, is up 12.51% on the year. Utility stocks, which generate reliable returns year in, year out, have delivered an unusually high 12.70% return to their investors since January 1.
In the bond markets, the inverted yield curve has finally started to sort itself back out toward normalcy. Treasuries of 3-month (3.75%) and 6-month (3.93%) duration are offering comparable yields to securities with 1-year (3.92%) maturities. 5-year Treasuries are yielding 4.23%, 10-year government bonds are yielding 4.48% and 30-year maturities are generating 4.99% annual coupon rates. Five-year municipal bonds are yielding 2.56% in aggregate, while 30-year munis are yielding 4.15%.
By any measure, the second quarter—and, indeed, the first half of the year—represent a massive market rally. Market sentiment seems to be impervious to a shaky truce in the Middle East, inflation and rising interest rates and jobs reports that suggest an economic downturn somewhere on the near horizon. No doubt, the enthusiasm has been stoked by the fact that corporate earnings have exceeded expectations, and the artificial intelligence spending boom hasn’t abated. Aggregate earnings on the companies in the S&P 500 have increased by 25% year over year and most analysts are on record predicting that their momentum will continue.
The question of the hour is whether the spectacular market rally is also being driven by speculative fever, what we used to call FOMO, fear of missing out. A recent Harris poll found that 80% of respondents admitted that they had been making high risk or speculative investments recently because they feel financially left behind. On top of that, American households now hold an unprecedented 45% of their total financial assets directly in stocks, despite also sporting a rising debt burden.
If this sounds familiar, well, market signals often tell conflicting stories, which is a reminder that we can’t look at tea leaves, earnings, crystal balls, economic reports or pundit forecasts as reliable indicators of what’s going to happen next. If you were to have asked observers what they expected after a somewhat miserable first three months, the answer would have been “more of the same,” which is definitely what we did not get. Just like a rollercoaster, when markets soar it’s time to tighten our seat belts for some turbulence—and hope it doesn’t come.
Download a PDF version of this article below.