Monthly Market Commentary
Asset class returns declined broadly for the third consecutive month in October.
Treasury yields continued to climb and put pressure on both equity and fixed income assets as the 10-year yield reached 5% for the first time since 2007. In addition, a tepid start to the corporate earnings season combined with geopolitical uncertainty exacerbated risk aversion for many investors during the month.
- Domestic large-cap stocks (S&P 500 Index) outperformed small-cap stocks (Russell 2000 Index) by a wide margin, returning -2.1% and -6.8% respectively, as mega-cap technology stocks out-performed.
- Bonds declined for six consecutive months for the first time since inception of the Aggregate Index in 19761. Bonds fell -1.6% for the month of October.
- Non-U.S. Developed (MSCI EAFE Index) and Emerging Markets equities (MSCI EM Index) underperformed U.S. large cap stocks, falling -4.1% and 3.9%, respectively. Expectations for slower economic growth in Europe and the ailing property sector in China weighed on non- U.S. stocks.
Domestic and non-U.S. Developed equity returns remain positive year-to-date, but performance has declined meaningfully since the July highs.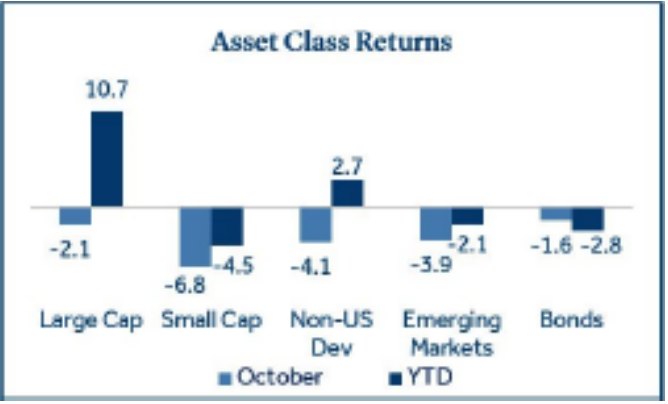
U.S. Stocks Update
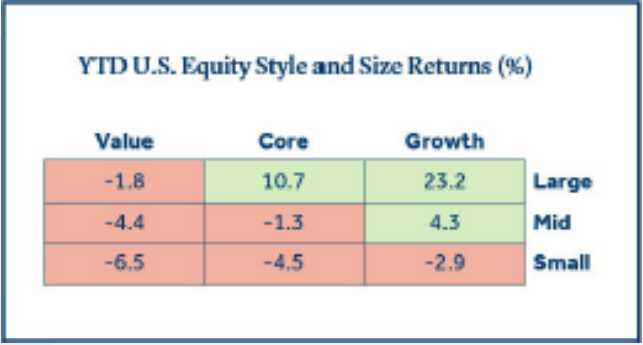
Growth-oriented, large-cap stocks have led the way year-to-date.
Several factors have driven out-performance for large-cap core and growth stocks relative to other domestic equity categories this year:
- Larger stocks overall can cushion the equity portion of a portfolio, relative to smaller stocks, during times of volatility and economic uncertainty like 2023.
- Large cap indices contain little exposure to smaller regional banks which have struggled amid rising interest rates. They are also overweight technology stocks, which have been a top performing sector year-to-date.
- Mega-cap technology stocks (e.g., Alphabet, Amazon, Apple, Meta, Microsoft, NVIDIA, and Tesla) have driven almost all year-to-date gains in the large cap core and growth indices. However, the weight of these stocks is much higher in the large growth index (47%)1 vs. the large core index (28%)1 and has provided an additional boost to large cap growth returns.
- Large cap out performance has led to a widening valuation gap as the price-to-earnings (P/E) ratio for the S&P 500 Index (22) is well above the Russell 2000 Index (12). It could be an appropriate time for valuation conscious investors to reassess their allocation to small cap stocks.
Interest Rates
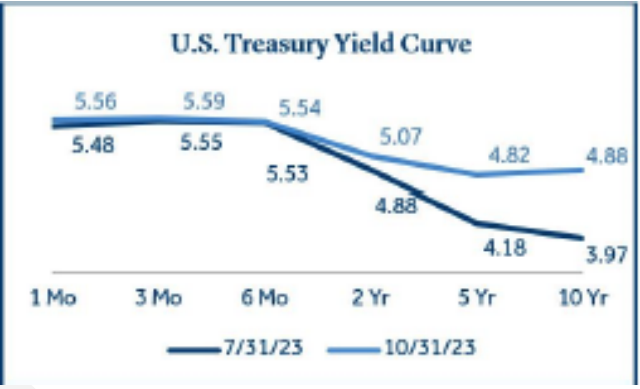
The 10-year U.S. Treasury yield in-creased for the sixth consecutive month.
The 10-year Treasury yield added over 100 basis points since mid-July and has been assigned much of the blame for the pullback in equities, as borrowing costs have risen for businesses and consumers. Rates have been rising consistently since the Federal Reserve (the Fed) began their rate hike campaign in March 2022. However, a shift within the trend of rising rates is that lon-ger-term rates have risen more than short-term rates. There are several potential drivers to the recent rise in longer-term Treasury yields:
- Fed rhetoric that interest rates will remain higher for longer amid elevated inflation.
- U.S. economic data has surprised to the upside as GDP, retail sales, and nonfarm payrolls all surpassed recent expectations.
- The risk premium to hold longer dated Treasuries may be rising as global economic uncertainty and geopolitical tensions mount.
Historically, inverted yield curves have preceded recessions, but the curve tends to de-invert before a recession actually begins. The chart below depicts the Treasury curve de-inverting over recent months as yield spreads between short and long-term rates have narrowed, this development has put many investors on recession watch.
Recession Watch
U.S. economic data has provided mixed signals.
Although GDP, retail sales, and nonfarm payrolls all exceeded their most recent estimates, several potential economic headwinds remain:
- The Consumer Price Index (3.7%) is hovering above the Fed’s 2%inflation target and has risen or been flat for three consecutive months. Oil prices declined in October, but they have increased 8.1% year-to-date and could put pressure on headline inflation.
- The Leading Economic Index (LEI), designed to indicate the direction of the economy, has declined for 18 consecutive months with nine of the index’s ten components flat or negative in September.
- Consumers may come under pressure as student loan payments resumed, pandemic savings have declined, and borrowing costs have risen.
The full impact of higher rates remains to be seen as a change in the Fed Funds rate is estimated to take 12-24 months to fully affect the economy. As the economic picture remains unclear, it’s important for investors to be diversified.
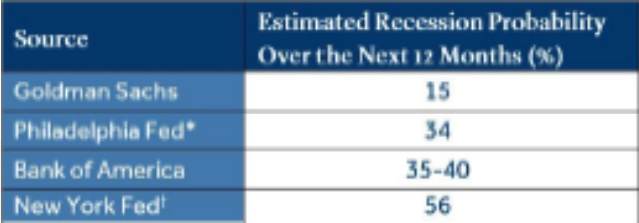
* Philadelphia Fed Recession Probability Index.
† Based on the nominal 10-year minus 3-month Treasury yield spread. Parameters are estimated using data from January 1959 to December 2009.
Geopolitical Risk
Conflict in the Middle East created additional uncertainty for investors.
First and foremost, our thoughts go out to those affected by recent events in Israel and the Middle East. It’s often difficult to predict the impact of geopolitical events on capital markets and the global economy. A few key points surrounding the current conflict:
- A primary market concern associated with conflict in the Middle East is rising oil prices, which have the potential to put upward pressure on inflation and dampen consumer spending. Although the price of oil initially increased 4.3% the trading day following the attacks in Israel, the price declined -8.7% for the month of October.
- The risk of escalation is top of mind for many investors. A broader conflict involving OPEC member countries (e.g., Saudi Arabia and Iran) could have economic ramifications.
- The initial effect on stocks was muted. The S&P 500 and MSCI EAFE (Non-US) Indices both registered positive returns in the first trading week following the beginning of the conflict.
Historically, geopolitical events lead to increased market volatility in the early stages, but it often subsides quickly5. A 2022 Mercer paper “Peering through the Fog” analyzed 20 geopolitical events (e.g., Iraq war, Brexit vote, etc.) ranging from 1939 to 2017 which indicated the following:
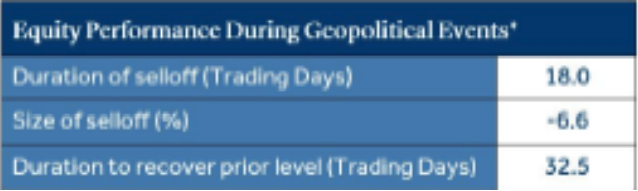
* Data is based on the S&P 500 Index and represents the median for all 20 geopolitical events included in the study.
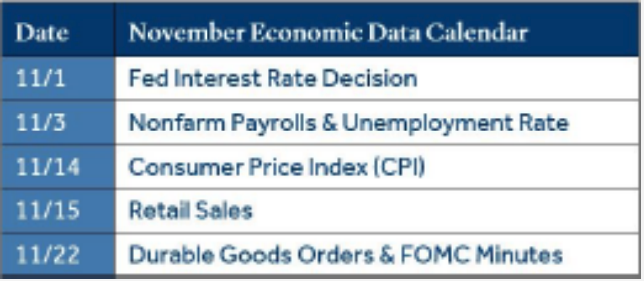
Economic Calendar
The Fed held short-term rates steady to begin November.
The decision to hold rates steady on November 1 was expected by many as Fed Funds futures suggest-ed a 98% probability there would be no change in the short-term lending rate.
- The policy making committee is likely near the top of the rate hike cycle as current Fed projections indicate the potential for one additional interest rate hike.
- Fed chair Jerome Powell stated, “the process of getting inflation sustainably down to 2% has a long way to go.” As of November 1, Fed Funds futures suggested the first rate cut is most likely to occur in June 2024.
- The Fed has continued to reduce its bond holdings (quantitative tightening) which has decreased the central bank balance sheet from $9 trillion to $7.9 trillion since March 2022.
Nonfarm payrolls will continue to be a focal point for investors as strength in the labor market has been a primary supporter of a soft-landing narrative for the U.S. economy.
What Happens When You Fail at Market Timing
The impact of being out of the market for just a short period of time can be profound, as shown by this hypothetical investment in the stocks that make up the Russell 3000 Index, a broad US stock market benchmark.
A hypothetical $1,000 investment made in 1998 turns into $6,356 for the 25-year period ending December 31, 2022. Over that same period, if you miss the Russell 3000’s best week, which ended November 28, 2008, the value shrinks to $5,304. Miss the three best months, which ended June 22, 2020, and the total return dwindles to $4,480.
Exhibit 1
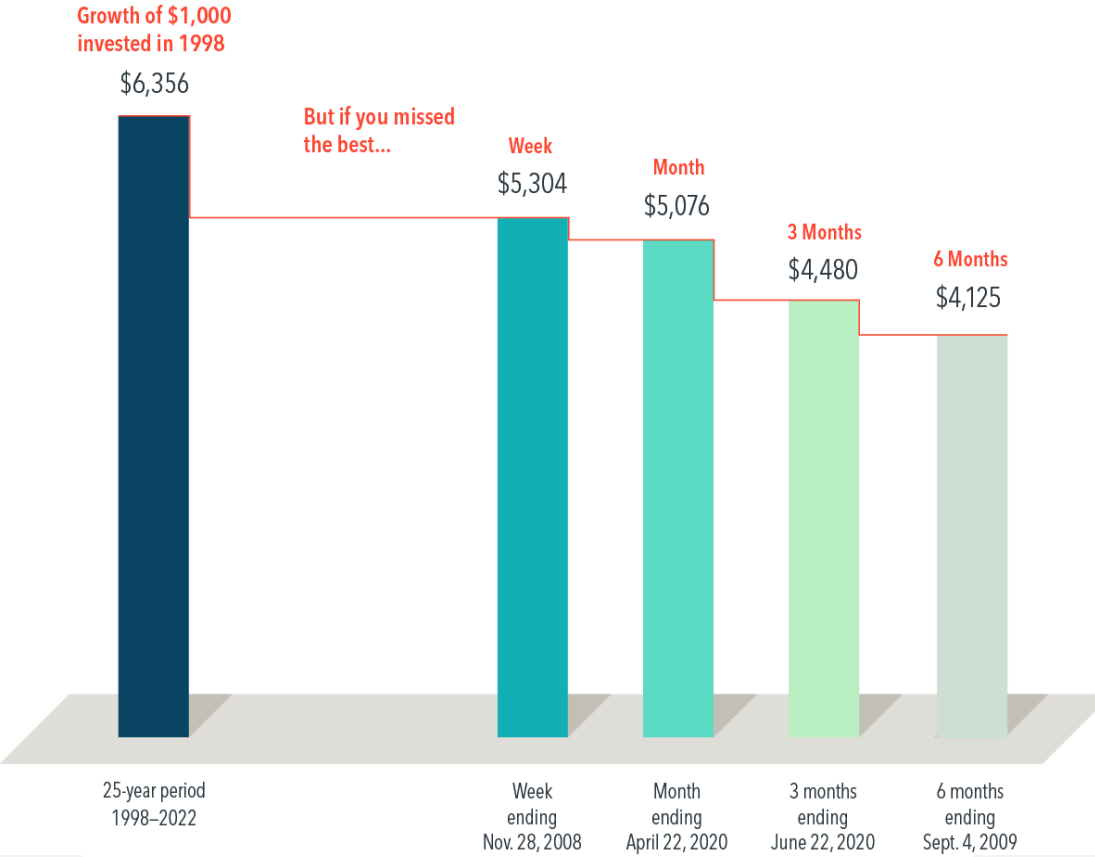
Missed Opportunity Russell 3000 Index total return, 1998-2022 Past performance, including hypothetical performance, is not a guarantee of future results. In US dollars. For illustrative purposes. Best performance dates represent end of period (November 28, 2008, for best week; April 22, 2020, for best month; June 22, 2020, for best three months; and September 4, 2009, for best six months). The missed best consecutive days examples assume that the hypothetical portfolio fully divested its holdings at the end of the day before the missed best consecutive days, held cash for the missed best consecutive days, and reinvested the entire portfolio in the Russell 3000 Index at the end of the missed best consecutive days. Data presented in the growth of $1000 exhibit is hypothetical and assumes reinvestment of income and no transaction costs or taxes. The data is for illustrative purposes only and is not indicative of any investment. Frank Russell Company is the source and owner of the trademarks, service marks, and copyrights related to the Russell Indexes. Indicesre not available for direct investment. Their performance does not reflect the expenses associated with the management of an actual portfolio.
There’s no proven way to time the market—targeting the best days or moving to the sidelines to avoid the worst—so the evidence suggests staying put through good times and bad. Missing only a brief period of strong returns can drastically impact overall performance. We believe that investing for the long term helps ensure that you’re in position to capture what the market has to offer.
Sources:
- Morningstar Direct
- London School of Economics
- The Conference Board
- Federal Reserve Bank of New York 5 Source: Mercer LLC
- CME FedWatch Tool
- Federal Reserve