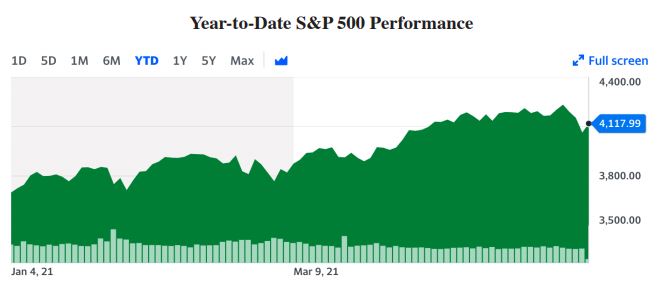
In the last few trading days, investors and traders were reminded once again that markets go down—sometimes with a lurch. The most recent lurch was this week’s 2.1% one-day decline in the popular S&P 500 index of U.S. stocks—which was described as “the biggest one-day drop since February,” in case anybody is an avid market historian. In the first three days of the week, the index had fallen 4%, which sounds kind of scary until you look at the year-to-date chart and see that, so far, this has been a pretty good year to be invested overall. Investors in U.S. stocks were still sitting on a 9% return for the year.
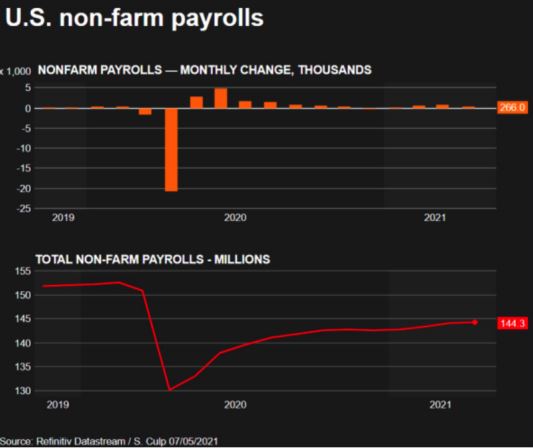
What caused the dip? Economists became nervous when employment numbers in March were revised downward and the number of jobs in April came in below expectations. The best estimate is that the U.S. economy is still 8.2 million jobs below its peak in February 2020, which means the recovery may not be proceeding as rapidly as some had hoped. Once again, when you look at a long-term graph, you can see that there are clear signs of progress from the bottom.
But the most common explanation for the market jitters was a sudden unexpected spike in the inflation rate. When government economists at the U.S. Department of Labor looked back at consumer prices in the month of April, they calculated, to everyone’s surprise, that the month-to-month gain in the cost of a basket of goods (including energy and housing costs) had risen 0.8% over March prices. This was well above the expected 0.2%, and caused traders to worry that the U.S. Federal Reserve Board would raise interest rates to counteract inflation, which would raise bond rates, and then bonds would more effectively compete with stocks for investment dollars.
If you were able to follow that chain of logic, congratulations. But a harder look at the numbers shows that much of the price increase came in the energy sector—energy prices, which can be notoriously volatile, jumped 25% from the same time last year, including a 49.6% increase for gasoline. Used car and truck prices were up 10% in April.
More worrisome to traders and pundits, the so-called producer price index, which is the inflation rate for companies and especially manufacturers, had risen 6.2% for the 12 months ending in April, which was well above the 3.8% forecasts offered by economists. But some are attributing these higher costs, at least in part, to the supply chain bottlenecks caused by border restrictions due to the pandemic, and more specifically to the ripple effect of the Suez Canal blockage in March.
What you probably haven’t read is that these “spikes” in inflation are also in part due to the fact that prices have been depressed due to the pandemic and the widespread shutdown of the U.S. economy. This has greatly distorted year-over-year comparisons and makes the inflation picture look a lot more worrisome that it probably is.
This is not to say that stocks won’t continue to go down a bit further; the emotional impacts of these selloffs have a way of feeding on themselves. But it is equally possible that the market will decide that the best days are still ahead. We are close to having the economy finally back on its feet and a majority of people vaccinated, which could drive growth—and stock value—over the remainder of the year. It would be nice to know in advance, but what we do know is that over time companies have tended to increase in value, as a result of the daily labors of their workers. Even if their stocks go on sale in the meantime.
Sources:

https://www.cnbc.com/2021/05/13/5-things-to-know-before-the-stock-market-opens-thursday-may-13.html

https://www.cnbc.com/2021/05/12/consumer-price-index-april-2021.html

https://www.reuters.com/business/what-us-inflation-signs-would-cause-fed-change-course-2021-05-13/

https://www.reuters.com/world/us/us-job-growth-far-below-expectations-april-amid-labor-shortages-2021-05-07/

This article was written by an independent third party. It is provided for informational and educational purposes only. The views and opinions expressed herein may not be those of Guardian Life Insurance Company of America (Guardian) or any of its subsidiaries or affiliates. Guardian does not verify and does not guarantee the accuracy or completeness of the information or opinions presented herein. S&P 500 Index is a market index generally considered representative of the stock market as a whole. The index focuses on the large-cap segment of the U.S. equities market. Indices are unmanaged, and one cannot invest directly in an index. Past performance is not a guarantee of future results.