 Individuals with advanced economic degrees and economists that are employed (sometimes at astronomical salaries) at the big brokerage firms have inside data that tells them where the economy is going. Right? After all, their views are routinely sought out and published by the major news outlets, so they must know SOMETHING that we don’t know.
The interesting thing about these various predictions is that nobody ever goes back and assesses whether the predictions and forecasts were, with the benefit of hindsight, actually accurate or helpful.
Until now. A new report by researchers at Washington University in St. Louis, MO gathered up the consensus forecasts from three popular economic surveys, including from chief financial officers at large publicly-traded firms and the economists at the Conference Board, and compared them with actual market events that occurred after the bold and confident forecasts.
The result? The authors found that in every case, the predictions were less accurate in predicting what would happen, short-term and long-term, in the market than what economists call a ‘random walk,’ which can be compared to throwing darts, assuming you have no skill at darts. The ‘gains’ listed in the researcher’s final table ranged from -0.99% in one year to -18.19% over six months—not the kind of market returns that most of us aspire to.
This confirms a longstanding experiment that the Wall Street Journal conducted some years ago, where expert stock-pickers named the stocks they expected to outperform over the next three to six months, and the Journal’s reporters threw darts to pick a comparison portfolio. Most of the time, the dart-throwers outperformed the expert stock-pickers.
So (one might ask) why do the news outlets seek out the predictions of economists and Wall Street analysts? The answer seems to be for entertainment value. Most of us like to think we know what’s going to happen, and having a person with an advanced degree and seven-figure salary, dressed in expensive business attire, telling us what is going to happen provides a sense of comfort—and maybe a temporary salve to the anxiety that comes with the uncertainty that we all live with in the real world.
Recession Returns
What if somebody could tell you the exact date when the next recession will begin, so you could get out of the market and wait it out. Wouldn’t that be great?
You can fantasize about this if you want. But it so happens that sitting on the sidelines during an economic recession is actually bad for your portfolio returns.
A study conducted by a mutual fund company called Dimensional Fund Advisors did something very simple: it looked at the start date of all re-cessions from January 1947 to December 2022, as announced by the National Bureau of Economic Research. Then it calculated the returns of the Standard & Poors 500 index for the ensuing one year, three and five years after the recessions were formally declared. Finally, it averaged those returns to show how investor portfolios, on average, fared during those times when the economy was in the tank.
The result was not encouraging to those who plan to move to the sidelines during recessions. On average, one-year market returns after the start of a recession came to a decently positive 6.4%. Three-year returns and 5-year returns were even more so: 43.7% and 70.5% over those time periods.
Looking over the data, the researchers noticed that markets have, on average, tended to experience most of their bear market declines before recessions were announced, and began recovering soon after-wards. The markets tended to trend upwards during the recession, perhaps because investors anticipated that it would end soon and good times would restore corporate health.
The bottom line is pretty clear: even if you knew the exact date and time that a recession would be announced (and you don’t), the future market movements would still be uncertain—and, on average, counterintuitive. Better to throw dice, or darts, or examine turtle shells to find out what’s coming in the future.
Spending in the Golden Years
The normal retirement planning models say that when we retire, we will spend the same amount of money out of our retirement portfolios each year on living expenses, trav-el, eating out, etc., with that total amount only rising each year as inflation makes all of those things incrementally more expensive.
But is that actually true in the real world? A recent report by the RAND Corporation examined the spending patterns of older Americans who participated in the University of Michigan’s Health and Retirement Survey. RAND researchers found that for single retirees, real spending declined after age 65 at a rate of about 1.7% a year; for coupled retirement households, the decline was 2.4% a year.
There are several possible explanations for this. One is that people might find their living expenses less affordable as they get older. But the researchers concluded that this was not a factor, because they found that the wealthiest group of survey participants showed the same spending declines as those with less wealth. In fact, they found that as retirees got older, across all wealth categories, they spent an increasing share of their budget on gifts and donations.
A better explanation, proposed but not proven in the research, is that younger retirees are more vigorous and more inclined to take trips and eat out in their 60s and early 70s than they are when they get older. They might also become less interested in luxury goods like new cars and clothing as they age.
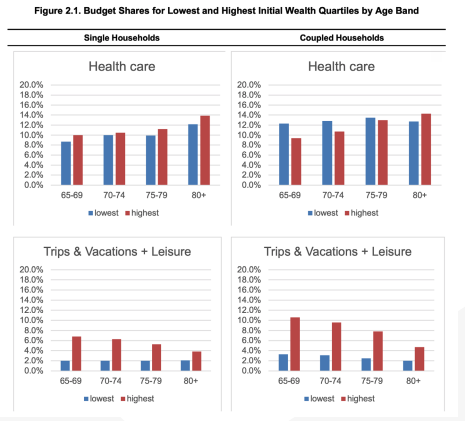
The median retiree household age 65-69 spent $28,505 (single) or $53,990 (married) a year, while retirees in their 80s spent $26,094 and $38,885 respectively. But of course there was considerable variation in this number; some retirees expect to spend more for a more lavish lifestyle than others. The study broke down expenditures by category, and found that trips and leisure expenditures fell the farthest as people got older (see chart), while healthcare expenditures were surprisingly stable, especially for coupled households. In all age categories, housing was the biggest budget item (23-25% of the total budget) followed by food (16-19%) and utilities (12-17%).
This healthcare statistic might surprise some people who had assumed that, later in life, people will have to allocate dramatically more to medical expenses than they did when they were younger and more vigorous. The study referenced an earlier study, which found that, for most individuals, the last year of life will typically engender a relatively affordable $6,800 in out of pocket payment for doctor and hospital visits; indeed, the healthcare percentage of a household’s budget averaged just 14% for people over 80 (compared with 9.4% for the youngest retirees). A relatively small number of people, roughly 10% of the sample, accounts for 42% of the out-of-pocket health-care spending in the later years of life—and the presumption is that much of this can be addressed by buying a long-term care insurance policy.
2023 Second Quarter Investment Report
Fears of an imminent recession are getting kind of old at this writing; any investors who retreated some or all of their portfolios to the sidelines in anticipation that the economy was about to tank are now ruing their luck, as the markets delivered another quarter of solid returns. It’s another version of the lesson: listen to the pundits predicting disaster at your (financial) peril.
The market gains in the second three months of year were stronger for larger stocks, but all sectors participated in the sunny investment climate. The Wilshire 5000 Total Market Index—the broadest measure of U.S. stocks—picked up 6.67% gains in the second quarter, and is now up 16.30% in the first six months of 2023. The comparable Russell 3000 index is up 16.17% so far this year.
Looking at large cap stocks, the Wilshire U.S. 2500 Large Cap index gained 6.67% in the most recent quarter, and is up 16.53% through the first half of the year. The Russell 1000 large-cap index has gained 16.58% so far this year, while the widely-quoted S&P 500 index of large company stocks jumped 8.30% in the second quarter, and has now gained 15.91% during the year’s first half.
Meanwhile, the Russell Midcap Index is up 9.01% through the second quarter. The Wilshire Midcap index gained 4.55% in the recent quarter, to stand at a positive 8.30% so far this year.
As measured by the Wilshire U.S. Small-Cap index, investors in smaller companies received a 5.58% gain for the most recent quarter, and are now sitting on 9.83% gains. The comparable Russell 2000 Small-Cap Index posted a 8.09% return over the past six months. The technology-heavy Nasdaq Composite Index, the biggest loser in 2022, is on a tear this year, posting a 31.73% return in this year’s first six months.
Foreign markets are delivering positive returns as well. The broad based EAFE index of companies in developed foreign economies gained 9.66% in the first half of 2023. In aggregate, European stocks are up 8.95% this year, while EAFE’s Far East Index delivered a positive 2.58% performance. Emerging market stocks of less developed countries, as represented by the EAFE EM index, gained 3.46% in dollar terms over the last six months.
Despite rising concerns about the impact of remote work and e-commerce on commercial properties, real estate securities produced decent returns. The Wilshire U.S. REIT index posted a 6.66% gain in the first quarter of 2023. However, other alternative parts of a diversified portfolio were not so fortunate. The S&P GSCI index, which measures commodities returns, lost 11.41% of its value in the most recent six months. Utility stocks are posting a rare 7.16% loss so far this year.
Bond rates rose dramatically last year, but that trend seems to have moderated. 30-year U.S. government bond yields barely moved from where they were three months ago, with current yields at 3.86%. 10-year government bonds are yielding 3.84%, and from there we enter the inverted yield curve: 5-year government securities are yielding a higher 4.16%, 2-year Treasuries are yielding 4.90%, one-year government bonds are yielding 5.39% and 6-month securities are now yielding 5.41%. To say this is not normal is an understatement. Whenever short-er-term bonds are paying bond investors more than their longer-term counterparts, it means that bond investors (and, maybe, most professional investors) are feeling cautious about the future of the market.
Municipal bonds are a somewhat less dramatic story at the moment, but there is still inversion going on; 30-year munis, on average, are yielding 3.57%, and 10-year maturities are yielding 2.55%. But the inversion can be seen in 5-year (2.61%), 2-year (2.92%) and 1-year (3.01%) aggregate yields.
Of course, we’re all wondering: will the second half of the year be as rewarding as the first half was? Our economic future has seldom been as cloudy as it is today, which is to say that the indicators are all over the place. In America’s manufacturing sector, the ISM Purchasing Managers Index, a closely watched indicator of the health of manufacturing firms overall, suggests that manufacturing has been in a recession for the past seven months. Global indicators are saying essentially the same thing about manufacturing competitors overseas. New export orders for goods have been falling globally at the fastest pace since the end of 2022.
Adding to the downbeat news, the Conference Board’s Leading Economic Index has been declining for 13 consecutive months, and the most oftencited recession indicator, the dramatic yield curve inversion in the bond market, is flashing its signals louder than ever. The corporate sector has not been unaffected by all this: financial and nonfinancial U.S. corporations have reported lower profits for the past two quarters.
But those indicators might actually make up less than half the story. The unemployment rate in the U.S. remains under 4% (bouncing between 3.4% and 3.7%) and the labor participation rate among workers aged 25 to 54 stands at a very strong 83.4%—the highest level since 2007. Consumer spending has remained brisk, with durable goods orders up 1.7% last month over the previous month. U.S. households are still flush with cash that was saved during the pandemic; the Federal Reserve Bank of San Francisco has estimated that households still have sufficient savings to support current spending levels at least through the fourth quarter of 2023. Indeed, the most recent consumer confidence index, measured by the Conference Board, rose to 109.7, the highest since early 2022.
And, not incidentally, the inflation rate keeps falling. Last year, alarm bells were sounding because June’s annualized rate hit 9.1%. Today’s rate is an annualized 4.0%.
There’s no reason to imagine that any of us can predict the future with any accuracy, except to point out that markets have, historically, trended upward and rewarded patient investors. It’s possible that a future recession will test our collective patience once again, but it’s a test that will be easier to pass due to the gains that this year has provided us already.
Click the button below to download a PDF version of this article.