 Actual Military Spending
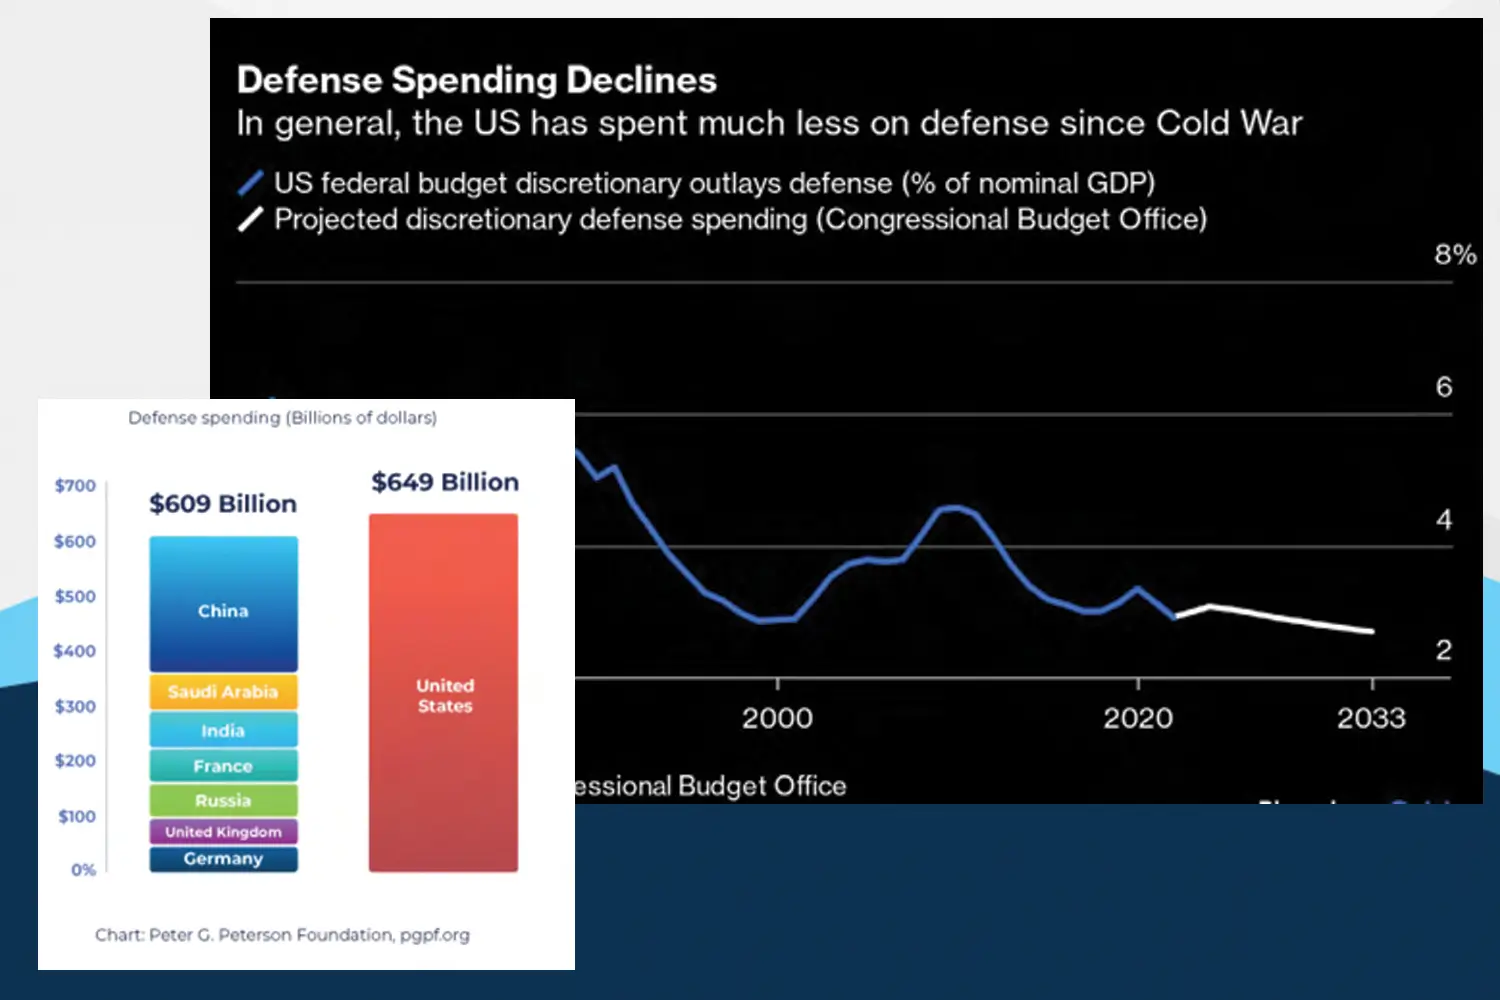
The U.S. military budget just keeps going up, year after year, as a percentage of the U.S. economy, and the amount of support the U.S. is sending to Israel and Ukraine is driving it through the roof. Right?
Interestingly, this common take that we read in the press is completely wrong. As the chart shows, as a percentage of the U.S. economy, defense spending has been declining, off and on, since the 1980s, and that trend is projected to continue. However we feel about the support for allies and Russian victims, the idea that the support is eroding the U.S. economy is plain wrong.
That said, it is not wrong to say that U.S. defense spending might be somewhat out of proportion. Look at the next chart, which shows that America spends more on its defense than the next seven countries—combined. Compare that with the so-called ‘general government function’—basically the costs of the branches of government and the federal government staff as a whole: at $133 billion, it’s less than a fifth of what we spend on our military.
Good and Bad Debt
You’ve probably read articles that talk about ‘good’ and ‘bad’ debt, but what, exactly, is the difference?
The simple answer is that good debt is borrowing in order to enhance your future net worth or personal prospects. You might put a home mortgage in this category, since over time homes tend to appreciate in value, and in the meantime you have the roof over your head to keep off the rain.
Borrowing to pay for higher education might also be considered good debt, but there’s a fine line there. If the degree you’re financing doesn’t lead to a job that will generate enough income to pay the interest on the student loan, then the debt moves into the ‘bad’ range.
Small business loans, if the money is used wisely, can be considered good debt; the firm will add staff, or a marketing budget, or otherwise use the loan proceeds to raise the value of the company. Of course, if the money is not deployed wisely, or if the projects invested in don’t bear fruit, then we can retroactively say it was bad debt. Almost a third of small businesses fail to survive their first two years, so startup money is more likely than not to eventually fall into the bad debt category.
There are numerous examples of bad debt, but they tend to fall into a few categories. Buying luxury items that you don’t need (think: an 80-inch TV to watch NFL games, or a very expensive automobile that also happens to be a gas guzzler) immediately fall into the bad debt category; if you really want or need those things, it’s better to save for them and avoid the interest rate charges. Especially problematic are those second homes on the lakefront that not only put you in debt, but also incur annual maintenance costs.
How do you know when you have too much debt? The Debt. org website suggests that if your monthly debt payments come to more than 43% of your monthly income, then it becomes a red flag to potential lenders. For instance, you probably won’t be able to get a mortgage if your ratio exceeds that amount.
There are a variety of debt consolidation options that can help people who fall into this ‘deeply in bad debt’ category, but they only work if the would-be consolidator is disciplined about paying off the consolidated debt on time each month, and is able to control spending (i.e., not racking up more credit card interest) going forward. It always helps to have a plan, even when the financial plan is focused on the debt side of the balance sheet.
2023 Investment Report
Last year, stocks were buffeted by the Federal Reserve Board’s aggressive rate hikes (the fastest since the 1980s stagflation era) and the reverse of the QE policies which, for a decade or more, flooded the markets with liquidity. There were persistent fears of a recession and market economists were comparing this perfect storm of headwinds to the declines triggered by the 2008 financial crisis. In one poll taken at this time last year, 85% of distinguished economists predicted a recession.
What happened? In a word, the pundits were wrong. Throughout 2023, particularly in the final quarter, the markets blew through the headwinds and posted unusually high gains nearly across the board.
A breakdown shows that just about every U.S. investment category was showing double-digit gains. The Wilshire 5000 Total Market Index— the broadest measure of U.S. stocks—gained 12.10% in the 4th quarter, and ended the year with a 26.10% gain. The comparable Russell 3000 index gained 7.73% in the month of December, and finished the year up 17.23%.
Looking at large cap stocks, the Wilshire U.S. 2500 Large Cap index was up 12.08% in the fourth quarter, and posted a 26.38% gain for 2023. The Russell 1000 large-cap index finished the year with a 26.53% gain, while the widely-quoted S&P 500 index of large company stocks gained 11.24% during the year’s final quarter and overall finished up 24.23% in calendar 2023.
Meanwhile, the Russell Midcap Index finished the 2023 calendar year up 17.23%.
As measured by the Wilshire U.S. Small-Cap index, investors in smaller companies received a 13.54% gain for the last quarter, for a gain of 19.50% for the year. The comparable Russell 2000 Small-Cap Index posted a 16.93% gain in the past 12 months. The technology-heavy Nasdaq Composite
Index was the biggest gainer in 2023; after dropping 28.27% of its value in 2022, it rebounded to gain 43.14% in 2023.
The foreign markets moved generally in lockstep with the U.S. gains. The broad-based EAFE index of companies in developed foreign economies gained 10.09% in the final quarter of 2023, to finish the year with a 15.03% gain in dollar terms. In aggregate, European stocks were up 16.68% in 2023, while EAFE’s Far East Index was up 12.77%. Emerging market stocks of less developed countries, as represented by the EAFE EM index, gained 7.04% in dollar terms on the year.
Real estate securities surprised on the upside, given widely-publicized woes in the world of office buildings. The Wilshire U.S. REIT index posted a 16.10% gain in 2023, all of it coming from the 16.30% gain in the final three months of the year. On the other side of the ledger, the S&P GSCI index, which measures commodities returns, posted an alarming 12.14% loss in the 4th quarter, ending the year down 12.20%. Utility stocks lost 10.20% in 2023.
The dramatic interest rate movements in 2022, which led to unusually steep losses in bond portfolios, thankfully didn’t carry over to 2023. Yields on 10-year Treasury bonds rose from 3.87% to 4.76% currently. 30-year government bond yields rose incrementally from 3.96% at this time last year to 4.03% as of the start of the new year. Five-year municipal bonds have dropped from a 2.56% annual rate down to 2.22% in aggregate, while 30-year munis moved from 3.63% at the beginning of the year to roughly 3.40% today.
2023 was undeniably an eventful market year. While the Fed was raising interest rates, three regional banks failed, and analysts cited the headwinds of interest rates and depositors making unusual runs on their lending institutions. Rising mortgage rates cooled the housing market, and Congress flirted with defaulting on the U.S. debt through headline-grabbing brinkmanship over the debt ceiling. Gasoline prices fell and a decline in manufacturing and industrial production flew under the radar.
The inflation rate was constantly in the headlines, as it steadily dropped from the near-10% range in the middle of 2022. Prices are still rising at a 3% annual rate, which is higher than the Federal Reserve target. The U.S. Central Bank is still engaged in quantitative tightening, shrinking its $9 trillion balance sheet by roughly $100 billion a month.
Perhaps the most under-noticed market story was how a very small number of stocks have come to dominate the robust returns of the U.S. indices. Seven stocks--Apple, Microsoft, Amazon, Nvidia, Alphabet, Meta Platforms and Tesla--accounted for 65% of the returns of the S&P 500, and because the index is capitalization- weighted (larger stocks count more than smaller ones), they now make up 28% of its weighting. The other 493 stocks in the large cap index, in aggregate, were actually underperforming.
For people with very long memories, this performance by the socalled ‘magnificent seven’ brings back echoes the ‘Nifty Fifty’ bubble in the 1960s and 1970s, when a small number of stocks (Xerox, IBM, Polaroid, Coca Cola, etc.) rose for decades, and seemed poised to rise to the moon. The shorthand version of the ending is that investor expectations of more of the same cause them to become overpriced, and they crashed in the 1973-74 bear market.
Will the future bring a similar result? Of course, we don’t know, but perhaps we can take comfort in the fact that we’re not alone. Most of the predictions made a year ago at this time turned out to be wrong, and they were offered by economists and others with fancy degrees and a lot of social media facetime. It’s becoming increasingly possible that the Fed- -viewed as reckless for most of last year, will finally get inflation under control and achieve that mythical ‘soft landing’ for the economy. It’s possible that artificial intelligence and a higher-tech economy will drive those seven stocks higher in the foreseeable future.
But whenever you see complacency, it’s time to be wary. A recession is still possible, and the markets are priced as if there is a certainty of good economic and company profit news in the year ahead. The unemployment rate has managed to stay at near-record lows for a surprisingly long time, and consumer spending continues to surprise on the upside. There is no guarantee that will continue. It’s worth noting that the S&P 500 index is currently sporting a 25.35% price-earnings ratio, which means that investors are paying between 71% and 129% more for a dollar of earnings today than they have over the long-term history of the markets.
These tea leaves aren’t telling us much, but in general, when markets are pricey and everybody seems to be expecting good news, it’s often a good time to stay cautious and control our expectations. Economists predicted a recession, which would have triggered a stock market decline. Instead, the economy remained steady and stock prices recovered from the down year of 2022. Today, a recent poll of economists showed that half of them now predict a soft landing, with more positive market returns going forward. Will the analysts and pundits be wrong again?
Click the button below for a downloadable version of this article.