Investing Lesson: Never try to predict a correction – you could be waiting a very long time for one to come and it could cost you a lot of money.
With the stock market racing to all-time highs and breaking records since bottoming in March of 2020, many investors are wondering how, why, and if they should get out of the market (or perhaps even get in!).
However, if you are already in a globally-structured market portfolio, there is nothing that you need to do other than stick to your personally designed financial plan and with your portfolio. The reality is that a globally-structured portfolio is designed for weathering stock market all-time highs and corrections. If you are waiting for a correction to get into a globally-diversified portfolio, don’t! Opportunity cost is real and can be very detrimental to your wealth if you miss out.
There is some great information in an article published on February 14, 2021 by Ben Carlson – A Short History of U.S. Stock Market Corrections & Bear Markets. Read the entire article below or click here. Don’t forget to share this information with your clients. Remind them to maintain a long-term perspective – growing wealth has no shortcuts.
A Short History of U.S. Stock Market Corrections & Bear Markets
Authored by Ben Carlson
Since bottoming last March following the Corona Crash, the S&P 500 is up nearly 80%.
And other than a brief downturn in September, the rise has gone on more or less unabated in terms of corrections.
Since 1950, the S&P 500 has experienced 36 double-digit drawdowns. That works out to one every other year or so on average.
So maybe we’re closing in on being due for a breather but these things don’t occur on a set schedule.
The stock market has been highly volatile since the turn of the century, experiencing crashes of 50%, 57% and 34%. It’s possible this level of heightened volatility is going to remain for the foreseeable future with an assist from the internet.
But markets can go through extremely long runs in-between sell-offs. The longest the stock market has gone without a double-digit correction since 1950 is 7 years from 1990-1997.
Then from 2002-2007 there was a four-and-half-year drought with no corrections.
This may surprise some people, but the third-longest streak of no market corrections over the past 70 years or so was the four years from late 2011 through late-2015.
Here’s the full list since 1950 (corrections in blue and bear markets in red):

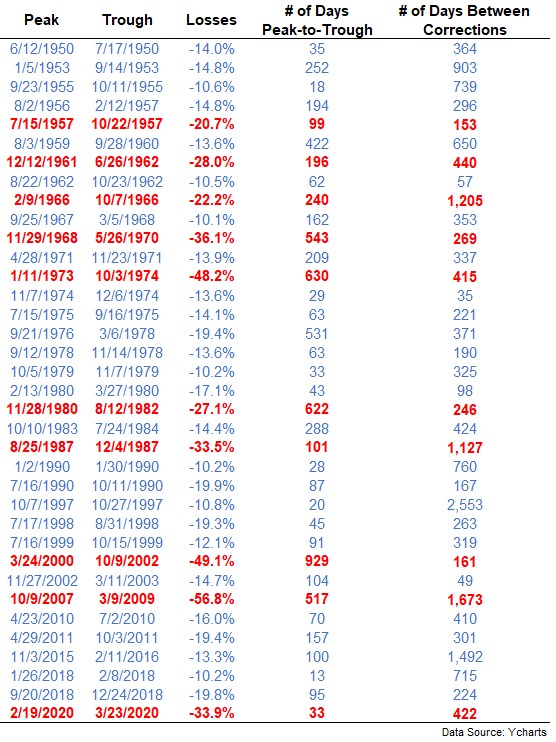
While double-digit corrections occur quite frequently, bear markets are more infrequent.
There have been 10 bear markets since 1950, meaning they have hit once every seven years, on average.
The longest time from bear market to bear market in modern market history was the 12 years and 4 months between the 1987 crash and the onset of the dot-com crash in 2000.1
Then there were the 11 years from the bottom in 2009 through the start of the Corona Crash last February.2
So you could be right about a coming market crash but have to wait a loooooong time for it to come.
And if you plan on waiting for a correction it’s not only time you could be missing out on but massive returns. These are the biggest gains on the S&P 500 that occurred between double-digit corrections:
1990-1997: +302%
1984-1987: +147%
2003-2007: +112%
2011-2015: +109%
This is why market timing can be such a destructive exercise. There can be a massive opportunity cost if you’re wrong.
Maybe markets are moving faster than they did in the past. Maybe we’ll have more corrections and bear markets because technology is speeding things up.
But don’t underestimate the market’s ability to continue rising. This is what makes predicting the stock market so difficult.
You always have to be prepared for a downturn but there are also times where markets scream higher without much resistance.
Disclosure:
The views expressed herein are exclusively those of Efficient Advisors, LLC (‘EA’), and are not meant as investment advice and are subject to change. All charts and graphs are presented for informational and analytical purposes only. No chart or graph is intended to be used as a guide to investing. EA portfolios may contain specific securities that have been mentioned herein. EA makes no claim as to the suitability of these securities. Past performance is not a guarantee of future performance. Information contained herein is derived from sources we believe to be reliable, however, we do not represent that this information is complete or accurate and it should not be relied upon as such. All opinions expressed herein are subject to change without notice. This information is prepared for general information only. It does not have regard to the specific investment objectives, financial situation and the particular needs of any specific person who may receive this report. You should seek financial advice regarding the appropriateness of investing in any security or investment strategy discussed or recommended in this report and should understand that statements regarding future prospects may not be realized. You should note that security values may fluctuate and that each security’s price or value may rise or fall. Accordingly, investors may receive back less than originally invested. Investing in any security involves certain systematic risks including, but not limited to, market risk, interest-rate risk, inflation risk, and event risk. These risks are in addition to any unsystematic risks associated with particular investment styles or strategies.