- Looking at average annualized returns going back decades, small cap stocks have beaten large cap stocks, value has outperformed growth, and high profitability stocks have outgained low profitability stocks. How should investors think about the performance of these premiums2 over shorter time periods?
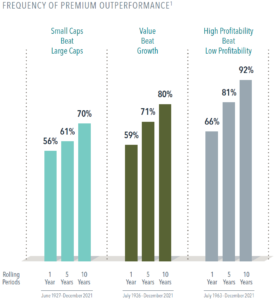
- We can evaluate the reliability of the premiums by examining performance during rolling, overlapping periods formed each month (e.g., January to December, February to January, etc.). Here, we assess rolling periods of one, five, and 10 years.
- The premiums were positive over most one- and five-year periods, and they increased over longer stretches. Value, for instance, beat growth in 80% of 1,027 measurable10-year periods.
When investors target the size, value, and profitability premiums, a long-term focus increases the odds of achieving positive outcomes.
1. Based on monthly rolling returns, computed as follows: Dimensional US Small Cap Index minus S&P 500 Index, June 1927–December 2021;
Fama/French US Value Research Index minus Fama/French Us Growth Research Index, July 1926–December 2021; and Fama/French US High
Profitability Index minus Fama/French US Low Profitability Index, July 1963–December 2021.
2. Size premium: The return difference between small market capitalization stocks and large market capitalization stocks. Value premium: The return
difference between stocks with low relative prices (value) and stocks with high relative prices (growth). Profitability premium: The return difference
between stocks of companies with high profitability over those with low profitability.
3. Small vs. Large: 1,124 periods of 1 year; 1,076 periods of 5 years; 1,016 periods of 10 years. Value vs. Growth: 1,135 periods of 1 year; 1,087 periods
of 5 years; 1,027 periods of 10 years; High Profitability vs. Low Profitability: 691 periods of 1 year; 643 periods of 5 years; 583 periods of 10 years.


Past performance is no guarantee of future results. Investing risks include loss of principal and fluctuating value. There is no guarantee an investment strategy will be successful. Indices are not available for direct
investment. Their performance does not reflect the expenses associated with the management of an actual portfolio.
In US dollars. S&P data © 2022 S&P Dow Jones Indices LLC, a division of S&P Global. All rights reserved.
Dimensional US Small Cap Index: Created by Dimensional in March 2007 and is compiled by Dimensional. It represents a market-capitalization-weighted index of securities of the smallest US companies whose market
capitalization falls in the lowest 8% of the total market capitalization of the eligible market. The eligible market is composed of securities of US companies traded on the NYSE, NYSE MKT (formerly AMEX), and Nasdaq Global
Market. Exclusions: non-US companies, REITs, UITs, and investment companies. From January 1975 to the present, the index excludes companies with the lowest profitability and highest relative price within the small cap universe.
The index also excludes those companies with the highest asset growth within the small cap universe. Profitability is measured as operating income before depreciation and amortization minus interest expense scaled by
book. Asset growth is defined as change in total assets from the prior fiscal year to current fiscal year. Source: CRSP and Compustat. The index monthly returns are computed as the simple average of the monthly returns of
12 subindices, each one reconstituted once a year at the end of a different month of the year. The calculation methodology for the Dimensional US Small Cap Index was amended on January 1, 2014, to include profitability
as a factor in selecting securities for inclusion in the index.
Fama/French US Value Research Index: July 1926–present: Provided by Fama/French from CRSP securities data. Includes the lower 30% in price-to-book of NYSE securities (plus NYSE Amex equivalents since July 1962
and Nasdaq equivalents since 1973).
Fama/French US Growth Research Index: July 1926–present: Provided by Fama/French from CRSP securities data. Includes the higher 30% in price-to-book of NYSE securities (plus NYSE Amex equivalents since July 1962
and Nasdaq equivalents since 1973).
Fama/French US High Profitability Index: July 1963–present: Fama/French US High Profitability Index. Courtesy of Fama/French from CRSP and Compustat securities data. Includes all stocks in the upper 30% operating
profitability range of NYSE eligible firms; rebalanced annually in June. OP for June of year t is annual revenues minus cost of goods sold, interest expense, and selling, general, and administrative expenses divided by book
equity for the last fiscal year end in t-1. Fama/French and multifactor data provided by Fama/French.
Fama/French US Low Profitability Index: July 1963–present: Fama/French US Low Profitability Index. Courtesy of Fama/French from CRSP and Compustat securities data. Includes all stocks in the lower 30% operating profitability
range of NYSE eligible firms; rebalanced annually in June. OP for June of year t is annual revenues minus cost of goods sold, interest expense, and selling, general, and administrative expenses divided by book equity for the
last fiscal year end in t-1. Fama/French and multifactor data provided by Fama/French.
Results shown during periods prior to each index’s index inception date do not represent actual returns of the respective index. Other periods selected may have different results, including losses. Backtested index performance
is hypothetical and is provided for informational purposes only to indicate historical performance had the index been calculated over the relevant time periods. Backtested performance results assume the reinvestment of
dividends and capital gains. Profitability is measured as operating income before depreciation and amortization minus interest expense scaled by book.
Eugene Fama and Ken French are members of the Board of Directors of the general partner of, and provide consulting services to, Dimensional Fund Advisors LP.
Dimensional Fund Advisors LP is an investment advisor registered with the Securities and Exchange Commission.
Investment products: • Not FDIC Insured • Not Bank Guaranteed • May Lose Value
Dimensional Fund Advisors does not have any bank affiliates.