Wes Crill, PhD
Head of Investment Strategists and Vice President
One of the more vocal arguments against value investing stems from a belief that we’re in a “new normal” environment where innovative or high-tech companies have a leg up on “old guard” industries, such as energy or financials. FAANG stocks have typically been the poster children for this position; these behemoth technology companies have contributed meaningfully to the market’s overall return and, by virtue of being growth stocks, the negative value premiums in recent years. Well, guess who showed up as value this summer! That’s right, Russell reclassified Meta (formerly Facebook, the “F” in FAANG) and Netfix (the “N”) from growth to value during the index provider’s annual reconstitution event. Although signs have been pointing to the waning dominance of FAANG stocks since the start of 2022, it is somewhat ironic that 40% of the pillars supporting an aversion to value investing have now become value stocks themselves.
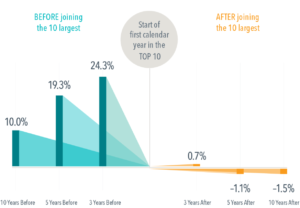
This also serves to highlight a possible misconception about the spirit of value investing. A value premium is a discount-rate effect: If expected future cash flows are not identically discounted for all stocks, then the ones with low prices relative to their expected future cash fows have higher expected returns. Investors advocating for the superiority of growth firms, such as the FAANGs, are inadvertently making the case for their expected future cash fows to be discounted at a lower level—all else equal, greater certainty around future success should be associated with a lower expected return. In fact, as Exhibit 1 shows, this is generally what we see for stocks of companies once they grow to become among the largest in the market. In other words, investors should be careful about equating expected company success with expected stock returns.
Exhibit 1
What Have You Done
for Me Lately?
Average annualized outperformance of companies before and after the first year they became one of 10 largest in US
In USD. Data from CRSP and Compustat for the time period 1927-2021. Average annualized outperformance of
companies before and after the first year they became one of 10 largest in US. Companies are sorted every January by
beginning of month market capitalization to identify first time entrants into the top 10. Market defined as Fama/French
Total US Market Research Index. The Fama/French Indices represent academic concepts that may be used in portfolio
construction and are not available for direct investment or for use as a benchmark. Index returns are not representative of
actual portfolios and do not reflect costs and fees associated with an actual investment. Index has been included for
comparative purposes only.
(Compared to Fama/French Total US Market Research Index, 1927–2021)
Past performance is no guarantee of future results.
View the article here: https://my-cms.dimensional.com/faangs-gone-value
