Oil’s Return to Normalcy
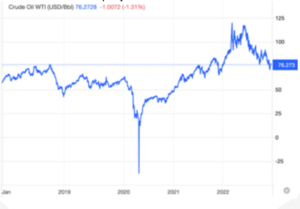
Just a couple of months ago, oil was selling on the international markets at upwards of $115 a barrel, and the gas prices at the pump were ranging around 4-5 dollars a gallon. Now, you can fill your tank at less than $3 a gallon in most places, and barrels of oil are trading at around $76. If you look at the 5-year price chart for oil, you can see the Covid pandemic and the Russian invasion of Ukraine having rather dramatic (and opposite) effects on oil prices, and the trend since mid-2022 has been a return to normalcy. Over the years, there have been a number of alarmist predictions about how the world is running out of oil, how temporary price increases were going to continue forever, etc. Each time the global economy corrected itself and reduced the alarming trend to a blip on the screen. If there is a trend, it is that demand for oil will continue to decline as alternative energy sources become more popular, and as more automobiles are powered by electricity. According to the most basic economic theory, lower demand would mean lower prices. In fact, total oil production worldwide last year (89.88 million barrels a day) is actually lower than production levels in 2015. The peak came in 2019 (just under 95 million barrels) and has been incrementally declining ever since. We aren’t running out of oil, but we are very slowly reducing our need or demand for it.
Trends and Forecasts
Every year, the Exploding Topics website issues a report on what its various surveys of economists say are the key economic trends for the next couple of years. In the latest report, it warns about the risk of stagflation (where inflation is high at the same time that the economy moves into a recession), but didn’t actually predict that this would happen. Real estate sales may drop, due to persistently high prices and high mortgage rates. Europe could experience an energy crisis this winter, and accelerating climate change may start becoming not just visible but damaging to global economies. The two trends that are likely to have an immediate impact on the economy and the investment markets have to do with consumer spending and the ability of companies to sell their goods and services. One of the charts, reproduced here, tracks the buying conditions for durable goods from the University of Michigan’s monthly Survey of Consumers. It found a rapidly plummeting situation, where high interest rates and rising prices are causing fewer consumers to finance expensive purchases.
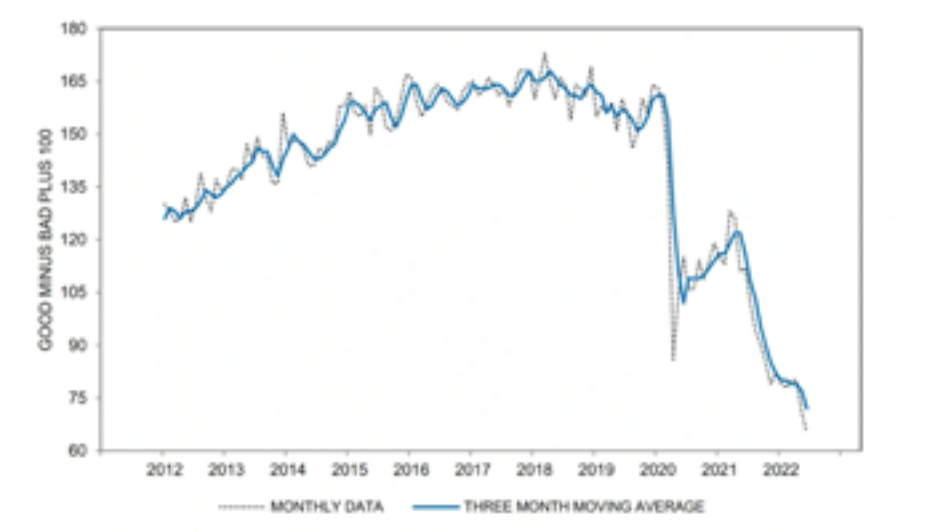
If there is indeed a slowdown among consumers, that would cause manufacturers and retail outlets to experience a glut of inventory. Many of these companies expected that consumer demand would roar back after the pandemic ended, but those high prices and the fact that the pandemic lingered might produce a disappointing market experience that could lead to a short-term decline in sales and profits. One should remember that these are predictions, and predictions are not the same thing as reality. There’s a wonderful joke to the effect that the ‘science’ of economics exists in order to make the predictions of gypsy fortunetellers look reputable. To know what’s going to happen, we’re going to have to experience it directly.
Worst-Case Investing
The market is experiencing another lurching downturn after experiencing another couple of weeks of encouraging gains, and that tells you most of what you need to know about the markets. Despite the breathless reporting in the financial press, stock prices go up, and down, and up, and down more or less at random (in the short term) and consistently show incremental gains (in the longer term). Unfortunately, it’s hard to see that generally upward trend for all the short-term noise.
Of course, it’s possible that this time it’s different; that the century-long increases in share prices (plus dividend payments) are about to come to an end. We may be entering a time when all the efforts of all the people who go to work in the offices of all the publicly-traded companies (or, lately, in their homes) will lead, against all logic, to consistently declining long-term value, and the markets will go down, down, down until they finally touch bottom. Of course, long before that happens, most people will be out of work, companies in every sector will go bankrupt, and chaos will reign.
People will sometimes fear the worst, and ask what kind of investments would thrive in a worst-case economic/market scenario. And there is a ready answer for that. Your best ‘investments’ (if you could call them that) for a total breakdown of the economic system would be a hideout deep in the woods, guns and ammo to protect yourself from the hungry masses, and plenty of seeds so you could grow your own food. A very large stockpile of canned/concentrated food and access to a water supply would complete the picture, and if you believe that some kind of barter system would survive the global catastrophe, then maybe you could stockpile gold Kruegerrands.
Of course, the end of the world has been predicted more than a few times over the years, and their historical failure rate is running right at 100%. We may see a recession next year, we will certainly see more confusing fluctuation in share prices day in, day out, and the financial press will continue to think that these entirely normal market fluctuations are ‘news.’ But if history is any indication, patience in the markets, and a strong stomach for bumps in the roller coaster, may be rewarded in the end.
And if they’re not, we may have a lot more to worry about than the value of our investment portfolios.
Past performance is not a guarantee of future results. All investments contain risk and may lose value.
The Newly-Passed Secure Act 2.0
Raise your hand if you think Congress should get out of the habit of passing tax legislation hours before the end of the year, and giving the professionals zero time to plan for it.
In the waning days of 2022, Congress passed something called the Consolidated Appropriations Act of 2023, which authorizes roughly a year of federal spending ($1.7 trillion worth), and also includes the SECURE Act 2.0, with a number of provisions that might be of interest to financial consumers.
One provision that could be of interest to a number of retirees is a small push-back of the age when required minimum distributions (RMDs) begin. These, as you probably know, are amounts that people above a certain age are required to take out of their retirements plans (please note employees still actively employed aren’t subject to RMDs in their current employer-sponsored retirement plan), whether they need the money or not. Before the tax bill, that age was 72; people had to start taking their distributions in the year that they reached that age, and the distributions would be a higher percentage of the retirement assets for each subsequent year.
The new law has moved that RMD age from 72 to 73 for anyone who reaches age 72 in 2023 or thereafter. And anyone who reaches age 74 after December 31, 2032 will have to start taking RMDs by age 75. (SECURE 2.0 has no impact on people who are currently taking RMDs; they have to follow the same formula that they have been following up to now.)
One of the most draconian penalties in the tax code comes if someone were to miss taking out their full RMD in any tax year; the IRS penalty is an excise tax amounting to 50% of the amount that should have been distributed but was not. In the new bill, Congress reduced that surtax to 25% (still pretty steep), and reduced it further, to 10%, if the retiree catches and corrects the under-distribution before the next tax return is due or before the IRS sends a demand letter.
Beyond that, there are a number of what Congress must believe are enhancements to the existing panoply of retirement plan options. Previously, people participating in a company-sponsored Roth IRA account had to take annual RMDs; now they don’t—which levels the playing field with individual Roth accounts, which have never imposed RMD requirements. The bill would allow employers to offer Roth versions of SIMPLE and SEP plans; previously those plans could only include pre-tax funds. Employers will be permitted to deposit matching contributions into these Roth accounts, which would be included in the employee’s taxable income in the year of the contribution.
And a provision would allow employers to make matching contributions to a 401(k), 403(b) or SIMPLE IRA plan for qualified student loan payments—that is, payment on the debt incurred for higher education purposes.
Speaking of higher education, people who have set aside money in a state 529 plan to pay for college expenses, and no longer have a need to use it for that purpose, are now able to move those excess funds directly into a Roth IRA, up to a maximum of $35,000. The bill requires that the Roth IRA receiving the funds be in the name of the beneficiary of the 529 plan, and the 529 account must have been in existence for 15 years or longer. (Any contributions made in the most recent five years, and earnings on those contributions, are not eligible for this transfer.)
People over 50 have been able to make an additional $1,000 contribution to their IRA, what has been called a catch-up provision. But that amount has never been indexed to inflation. Now, starting next year, the catch-up contribution limit will be raised with the inflation rate, in increments of $100. Meanwhile, staring in 2025, increased catch-up provisions take effect. Participants aged 60-63 will be permitted to contribute up to $10,000 (up from the current $7,500) in their 401(k) plan, or $5,000 if they are participants in a SIMPLE plan.
Beyond that, the bill provides for various new exceptions to the 10% surtax imposed on people taking money out of their IRA or qualified retirement plan before age 59 1/2, and it creates a new type of ‘Emergency Savings Account’ that employers could set up for plan participants who don’t own more than 5% interest in their employer or receive more than $135,000 in compensation. The empoyees can make Roth designated contributions until the account reaches $2,500, and the money grows tax-free thereafter. The idea is that this money will be used whenever the family faces an emergency.
Two areas where many people were expecting changes did not change. The federal estate tax exemption was not reduced (with inflation indexing, it will be $12,920,000 in 2023; double that amount for married couples), and so-called ‘back-door’ Roth contributions are still a viable planning tool.
If Congress has to put tax legislation on the books in the waning minutes of the year, then at least we can be grateful that most of the provisions are positive ones, and that they don’t require an end-of-the-year planning scramble. (You can put your hand down now.)
2022 Investment Report
Many investors are no doubt glad to see 2022 in the rear view mirror, and if they do look back, the picture is not pretty. Stocks were buffeted by the Federal Reserve Board’s aggressive rate hikes (the fastest since the 1980s stagflation era) and the reverse of the QE policies which, for a decade or more, flooded the markets with liquidity. It didn’t help that there were persistent fears of a recession all through the last 12 months, and a certain level of alarm over the Russia-Ukraine war. 2022 saw the three main stock indexes post their first yearly drop since 2018, and market economists with long memories were comparing this perfect storm of headwinds to the declines triggered by the 2008 financial crisis.
A breakdown shows that just about every U.S. investment asset was showing double-digit declines. The Wilshire 5000 Total Market Index—the broadest measure of U.S. stocks—gained 7.10% in the 4th quarter, but ended the year with a 19.04% loss. The comparable Russell 3000 index was down 19.21% for the year.
Looking at large cap stocks, the Wilshire U.S. 2500 Large Cap index was up 7.12% in the fourth quarter, but still posted a 19.00% loss for 2022. The Russell 1000 large-cap index finished the year with a similar 19.13% loss, while the widely-quoted S&P 500 index of large company stocks gained 7.08% during the year’s final quarter and overall finished down 19.44% in calendar 2022.
Meanwhile, the Russell Midcap Index finished the 2022 calendar year down 17.32%.
As measured by the Wilshire U.S. Small-Cap index, investors in smaller companies received a 7.77% gain for the last quarter, but were still down 17.50% for the year. The comparable Russell 2000 Small-Cap Index posted a 20.44% loss in the past 12 months. The technology-heavy Nasdaq Composite Index was the biggest loser in 2022, dropping 28.27% of its value over the last 12 months.
The foreign markets were no better. The broad-based EAFE index of companies in developed foreign economies gained 17.00% in the final quarter of 2022, but still lost 16.79% of its value in dollar terms for the year just ended. In aggregate, European stocks lost 17.28% in 2022, while EAFE’s Far East Index was down 17.20%. Emerging market stocks of less developed countries, as represented by the EAFE EM index, lost 22.37% in dollar terms in the year.
Real estate securities produced even greater losses, albeit for small portions of most investment portfolios. The Wilshire U.S. REIT index posted a truly awful 26.81% loss in 2022. But due to global increases in oil prices (and oil company profits), the S&P GSCI index, which measures commodities returns, eked out a 0.38% gain in the 4th quarter, ending the year up 8.71%.
Perhaps the most dramatic market movements in 2022 occurred in the bond markets, where yields on 10-year Treasury bonds rose dramatically over the course of the year, from 0.95% a year ago to 3.87% currently. 30-year government bonds rose from 1.88% yields at this time last year to 3.96%. Five-year municipal bonds were providing, on average, a meager 0.60% yield last January; now the rate is a comparatively robust 2.56%, while 30-year munis are yielding 3.63% on average. Of course, for bond investors, these yield gains represented losses; when rates go up, the lower-yielding bonds that investors had purchased previously lose value proportionately.
The broad market downturn, in stocks and bonds, marks the end of an extraordinary period of investment history, a three-year run that saw many investors at or near doubling their portfolio values. The interesting thing is that, despite the declines, we are not currently in bear market territory–usually defined as a 20% decline.
What will the future bring? Of course, we don’t know, but perhaps we don’t know more deeply now, with all the mixed signals swirling around us, than we usually don’t know. It’s certainly possible that the Fed will achieve that mythical ‘soft landing’ for the economy in the coming year. Inflation seems to have peaked and is falling faster than many expected—the CPI is up just 0.1% in November, 7.1% year-over-year. The GDP, which measures growth in the economy, recovered in the third quarter; total economic activity in the U.S. expanded a healthy 2.9% for the three months ending September 30, and a survey of economists suggests that growth could reach 1.0% in the fourth quarter. Unemployment is still low, at 3.7%. Low unemployment, wage gains and near 1% gains in personal income are fueling an increase in consumer spending. U.S retail sales posted their strongest gains in eight months this past October.
But… investors may be cautious about feeling too optimistic quite yet, especially with that glimpse into the rear view mirror. 2022 marks the first year in history when the S&P 500 and 20-year Treasury bonds both experienced double-digit losses; the previous ‘record’ was 1969, when the S&P 500 lost 8.5% and long Treasuries declined by 5.1%. Global diversification also didn’t help, as both the MSCI EAFE and emerging markets experienced double-digit losses.
The problem for the investment markets is that what had been a strong tail wind is now a brisk head-wind.
The U.S. Central Bank is engaged in quantitative tightening, shrinking its $9 trillion balance sheet by roughly $100 billion a month. As the Fed economists continue to bring inflation down to a 2% annual rate, they are likely to raise the Fed funds rate to at least 5%, which makes short-term bond instruments competitive with stocks and reduces demand in the equities markets.
Meanwhile, the housing market recently experienced the ninth consecutive month of declining sales—almost certainly due to higher mortgage rates. And the Conference Board’s October index of leading economic indicators recently declined for the eighth straight month, which may signal an increasing risk of a recession in the coming year. That gloomy prediction is reinforced by the inverted yield curve. The recent spread between three-month and 10-year Treasury bonds has reached -0.77%. When investors buy long-term bonds at lower yields than short-term bonds, it means they’re expecting turmoil on the horizon.
When the markets decline as they did this past year, history tells us that they become a buying opportunity; in effect, they go on sale, and become more attractively priced than they were before the downturn. But there is no guarantee that stocks won’t become even more attractively priced at some point in the coming year; we just don’t know what to expect. What we do know is that in virtually every historical time period, stock prices have recovered, usually unexpectedly, and the biggest danger has always been to move to the sidelines at the wrong time and miss out on that next upsurge. If we knew any more than that about the future, you would be the first to hear from us.
Sources
- https://tradingeconomics.com/commodity/crude-oil
- https://www.statista.com/statistics/265203/global-oil-production-since-in-barrels-per-day/
- https://explodingtopics.com/blog/economic-trends
- https://www.yahoo.com/finance/news/bigchanges-to-the-retirement-system-are-includedin-congresss-end-of-year-bill-182514621.html
- https://www.kitces.com/blog/secure-act-2-omnibus-2022-hr-2954-rmd-75-529-roth-rolloverincrease-qcd-student-loan-match/
- https://www.yahoo.com/now/secure-2-0-act-retirement-150042550.html
- Wilshire index data
- Russell index data
- S&P index data
- https://www.marketwatch.com/investing/index/spx
- Nasdaq index data
- http://www.nasdaq.com/markets/indices/nasdaq-total-returns.aspx
- https://www.msci.com/end-of-day-data-search
- Commodities index data
- Treasury market rates
- http://www.bloomberg.com/markets/ratesbonds/corporate-bonds/
- https://www.advisorperspectives.com/articles/2022/12/19/fourth-quarter-2022-economic-review-and-outlook
- https://www.reuters.com/markets/us/futures-slip-lasttrading-day-torrid-year-2022-12-30/
Click the button below to download a PDF version of this article.