 Covid Recovery The U.S. vs. The World
There have been calls to declare that the U.S. economic recovery since the recent pandemic to be a miracle, and the Biden Administration’s various efforts— including the Inflation Reduction Act and the CHIPS Act—certainly led to a boost in economic activity.
But it might surprise you that a global ranking of economic recovery since the Covid crisis puts the U.S. only in 7th place internationally, behind, respectively, Finland, Norway, Germany, Switzerland, Australia and the Netherlands.
Seventh place is not terrible, considering that the rankings include 122 nations; in fact, the USA is listed among a pack of nations that were quite successful in navigating the Covid’s choppy economic waters. Right behind the U.S. in the rankings are Denmark, Iceland, Sweden, Canada, the UK, Austria and New Zealand. Japan came in at number 19, China at number 32, Russia at 36, and India at number 63. Down at the bottom, you find the usual suspects: Chad and Zambia, Venezuela, Gambia and the Democratic Republic of Congo, whose recovery is undoubtedly hampered by a raging civil war.
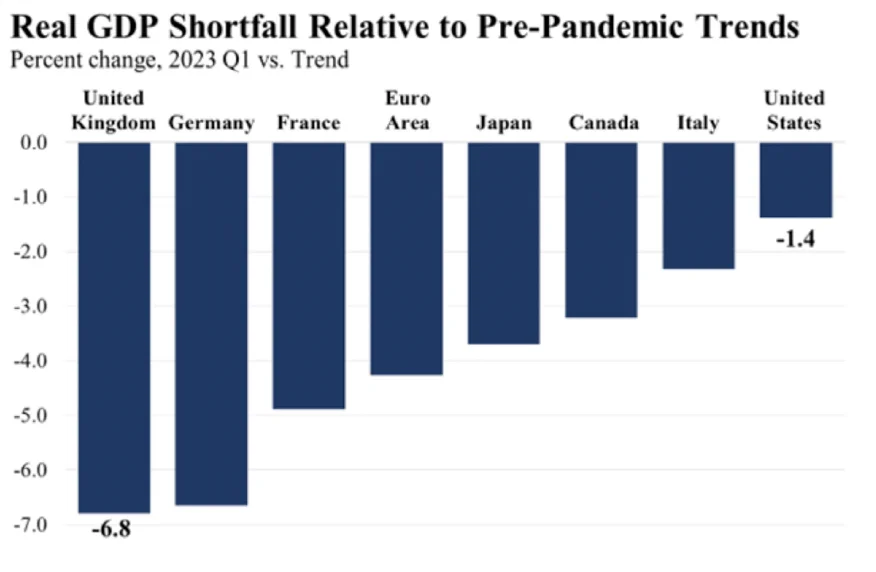
Another way of looking at the post-Covid recovery is to estimate how far each nation’s overall economic activity (measured by GDP) has recovered compared to what it would have been if the pre-Covid trends had continued without a pandemic-related interruption. The chart shows that by this measure, the U.S. is very nearly back on track, while the UK (held back a bit by Brexit), Germany, France, Japan, Canada and Italy are not quite so fortunate.
The political implications aside, it does appear that the U.S. is emerging from the awful slowdown with more vigor than most of its international peers. We can celebrate where the credit belongs: American companies and, most importantly, American workers.
Inflation's Good News, Worrisome Trend
When Federal Reserve Board economists kept insisting that 2022’s inflation levels were ‘transitory,’ it sometimes elicited derisive laughter from reporters. But it turns out they were right. As the Covid pandemic eased and supply chain problems were worked out, inflation fell from 9% back down to more normal levels, even as wages and interest rates (normal drivers of inflation) ticked upward.
Now that the December inflation numbers are in, the picture looks even better. The Fed looks most closely at the ‘core personal consumption expenditures’ price index, which tracks what households are actually spending, and by that measure, the inflation rate is running at 2.9%.
The more widely-followed Consumer Price Index came in at a 3.4% inflation rate for all of 2023. The chart shows the Covid decline (when everybody was hiding in their homes) and then the subsequent bulge when it became difficult for imported goods to get to market—and you can see inflation’s gradual retreat since the middle of 2022 as all of this got sorted out.
But you might notice that the rate has remained fairly steady for the past year, suggesting that price increases have settled in at somewhat higher levels than the 2%-2.5% historical numbers. That means that the Fed might eventually decide to give interest rates another nudge upward in hopes that that a higher Fed Funds Rate slow down spending enough to bring us back to the longstanding 2% inflation target. Nobody knows if or when that will happen, or what inflation might do to surprise us in the coming months, but for now it appears that inflation is no longer wildly out of control.
New Highs. Now What?
We’re all reading headlines telling us that the stock market has reached all-time highs, something that never happened in 2023. Many investors who have a worrisome mindset will think that means that there’s a high likelihood that we’ll see a downturn in the near future. The markets have nowhere to go but down from here, right?
There’s a kind of logic to this assumption, but history says that it’s actually wrong. Since 1973 (the modern stock market), the markets have achieved an average 10.1% positive return over the 12 months following an all-time high, which is actually higher than the average 12 month return from any random day during that time period (+9.5%). Going back further, for shorter time frames, since 1950, 80% of record highs have led to at least one more record high the following week, and the markets generally hit a new all-time high (again, on average) every 19 days.
If you go back 60 years (since 1964) the average one, two and three-year returns after a record high are 12%, 23% and 39% (these are aggregate, not annual returns), which is surprisingly close to the 12%, 25% and 38% average aggregate returns for all other one-, two- and three year time periods.
This is not to say that the markets will not or cannot go down from here; they can and they might. But the most consistent thing about the markets is that, no matter where you start, the overall long-term trend has been positive, and all-time highs are, perhaps surprisingly, no exception.
Click the button below for a downloadable version of this article.